A python/thrift profiling story
Posted on September 15, 2014
A few weeks ago I met a problem where a script, running once every night sending out some emails did not run correctly because a remote thrift call timed out in it. As I started investigating it, turned out that it's a search call:
staff_users = RemoteUserFactory().search(is_staff=True)The details here are not really important, what this call does is that it asks a service to return a set of users, and the communication is going on thrift.
Executing it manually on the server revealed that it should return 5649 users. Checking out the logs I could see that the call took extremely long time, between 8 to 12 seconds. Even when the cron job was moved from 3:00 AM to a less busy time (several other jobs were executing at the same time), it took more than 6 seconds!
This was suspicious so I also checked the log of a proxy which runs on the same host as the script itself and provides client side load balancing, circuit breaking, retry logic etc. for thrift connections. This log showed that the service replied in 2.5 seconds, but it took almost 4 seconds to get this response from the proxy to the client on localhost! This seemed to be completely unacceptable, and also the 2.5 second response time from the service seemed to be too big (I ran the query on one of the server nodes and it returned the users from the database almost instantly). I also had similar experience (but without measurements) before.
So I decided to find out what's going on. And I found the process interesting enough to write this post about it :)
Test environment
I started by adding a test method to the service's thrift API called test_get_users(count, sleep) which returns count fake users after waiting sleep seconds. Then in the following experiments I called it with (5499, 1). The 1 second sleep was intended to simulate the network latency and database query; there was no advantage from having it at the end, but as it is visible everywhere in the results, I had to mention.
For finding out what's going on I used cProfile with gprof2dot, calling the remote test method from a django shell, while everything is running on localhost.
First measurement
Without touching anything, returning 5499 dummy users on localhost took 5.272 seconds!
The client side of the call looked like this:
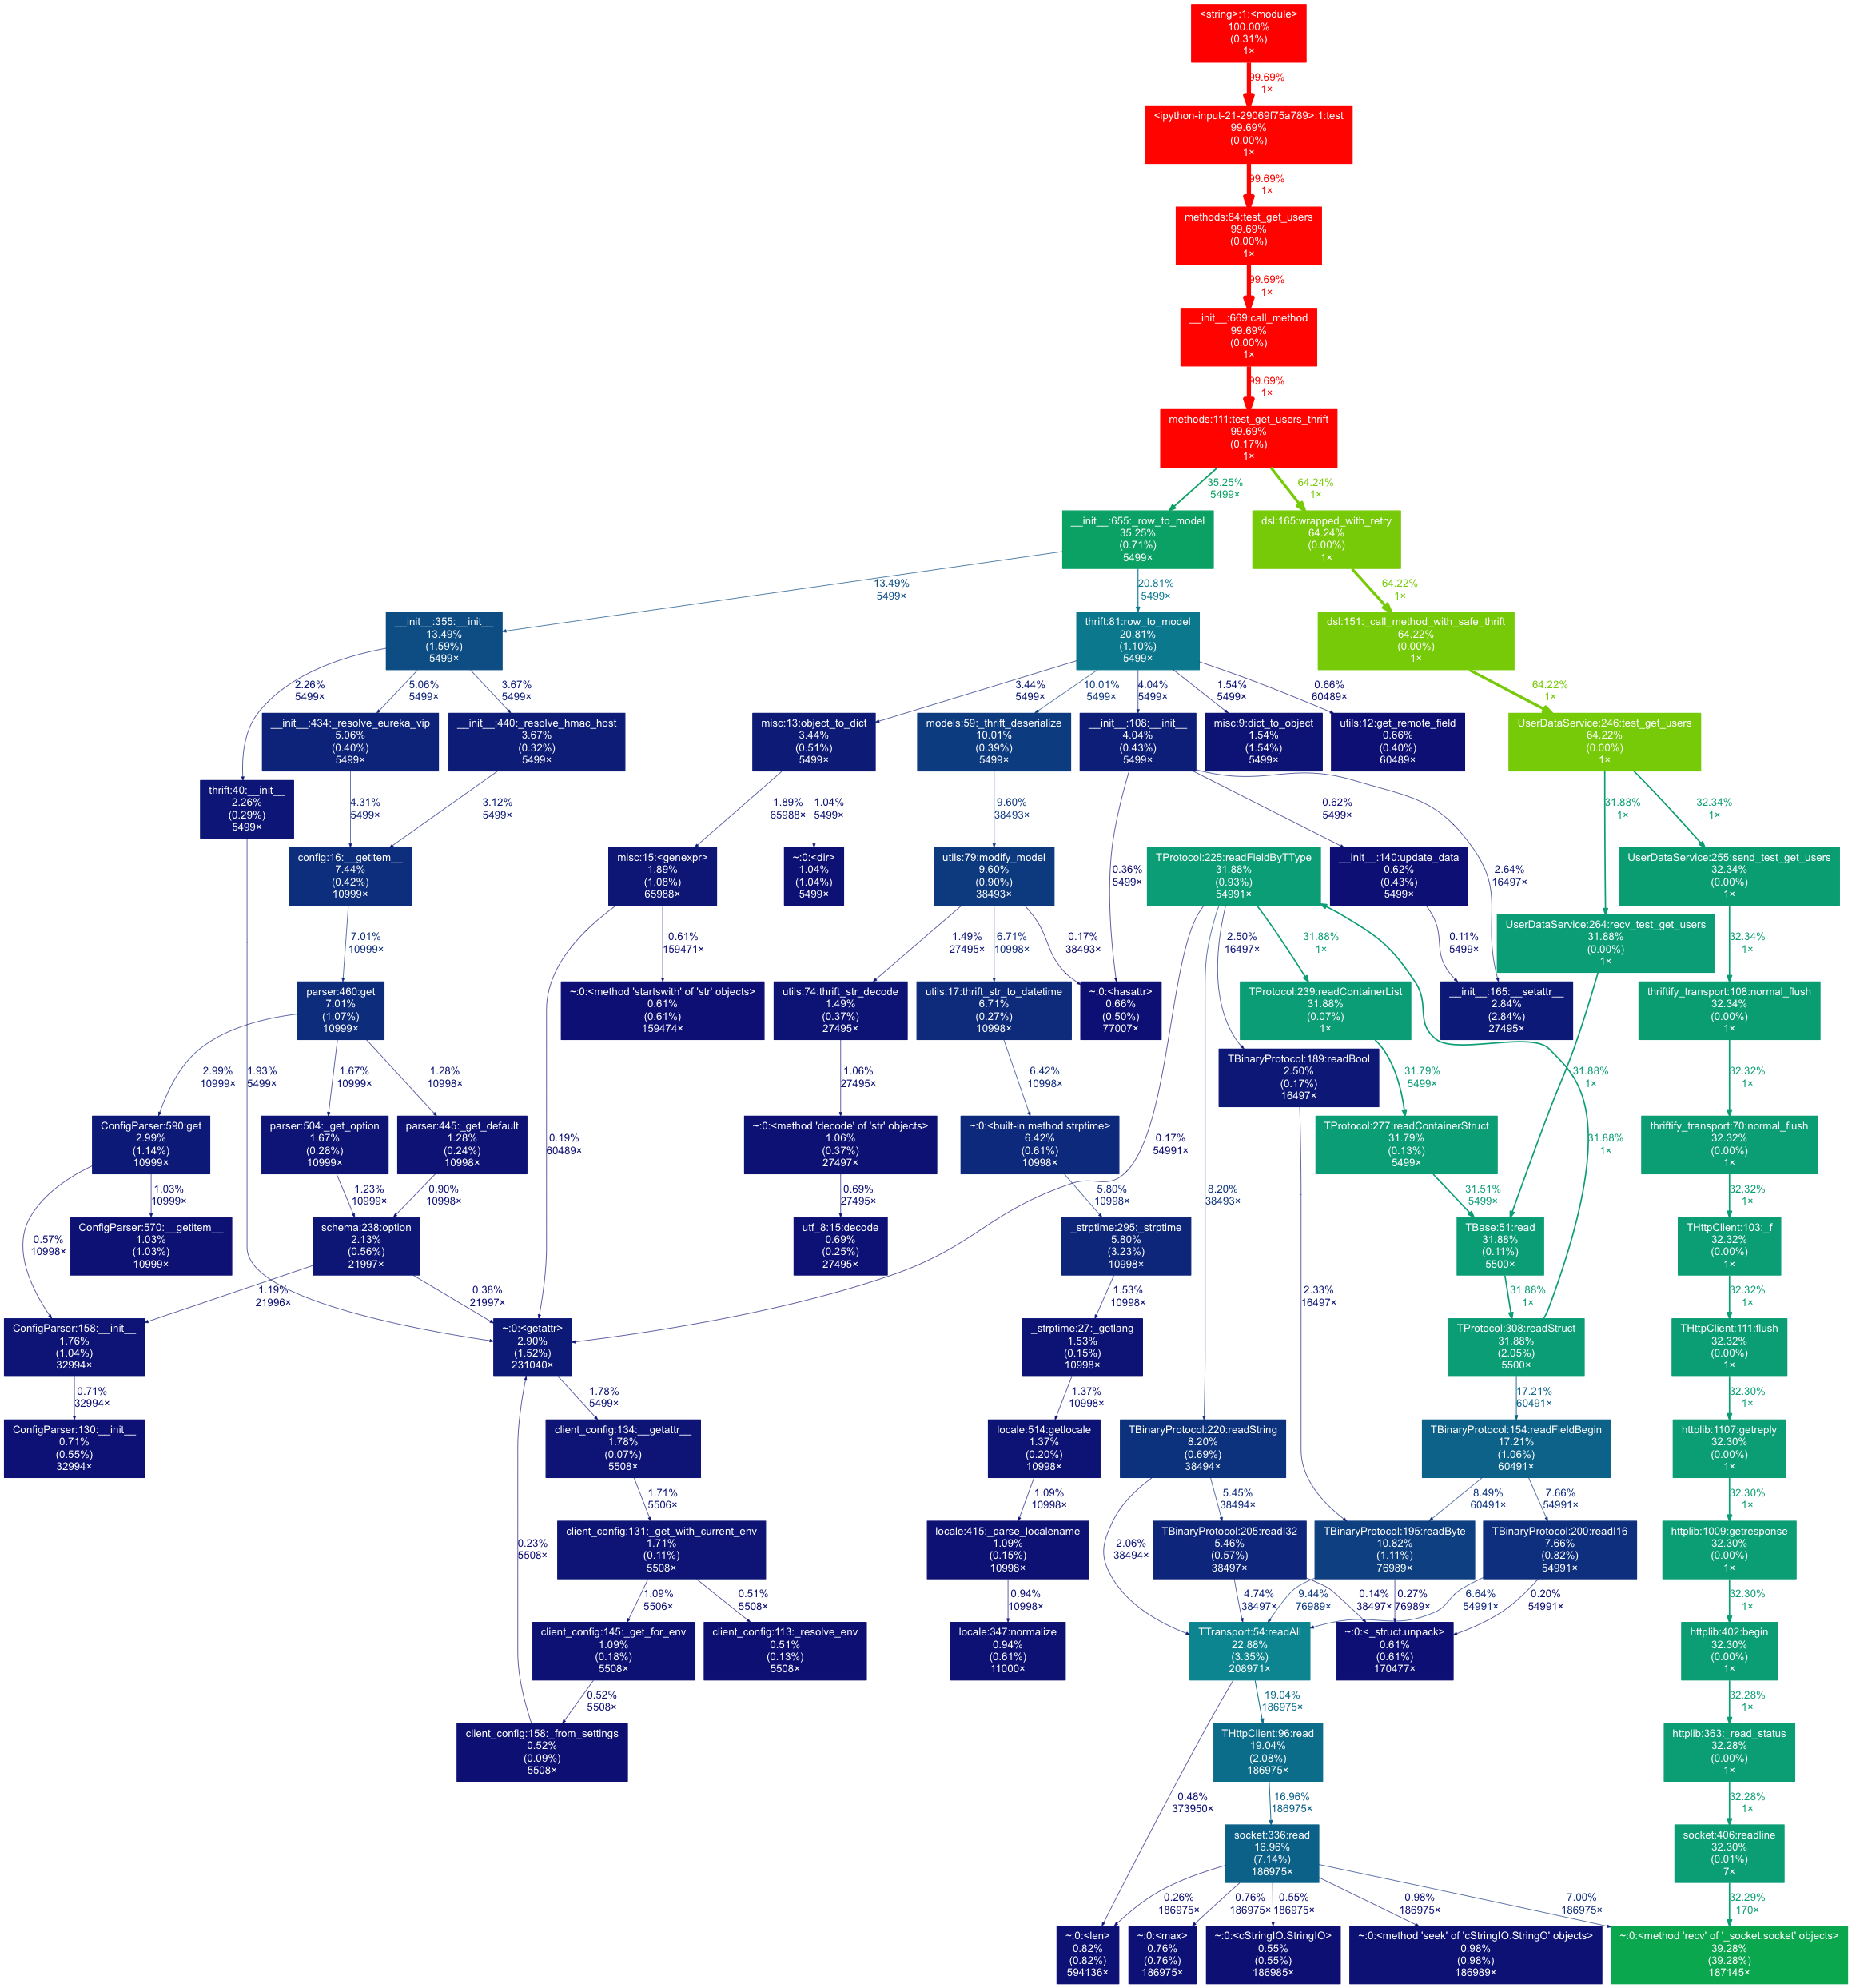
Here we can see that the call has two major phases:
- The thrift call itself (65%)
- Converting the raw results to model objects with
_row_to_model(35%)
Let's see first the thrift call (the green branch on the picture). Once again it has two, nearly equivalent branches:
send_test_get_userswhich sends the request and waits for the response. This includes the 1 second sleep as well.recv_test_get_usersprocesses the response
What's interesting here is that recv_test_get_users took ~32% of the overall time which is around ~1.6 seconds for simple data deserialization.
Optimizing thrift deserialization
I did not want to believe that the python thrift deserialization is that slow, so I did a search and found that the TBinaryProtocol which we are using is really that slow.
But the thrift library contains a class called TBinaryProtocolAccelerated which is about 10x faster (according to a stackoverflow post).
First I simply changed the used protocol to this, but nothing happened. Digging deeper I found that this is not a real protocol implementation, but a lower level hack.
The documentation of the protocol class says:
  C-Accelerated version of TBinaryProtocol.

  This class does not override any of TBinaryProtocol's methods,
  but the generated code recognizes it directly and will call into
  our C module to do the encoding, bypassing this object entirely.
  We inherit from TBinaryProtocol so that the normal TBinaryProtocol
  encoding can happen if the fastbinary module doesn't work for some
  reason.  (TODO(dreiss): Make this happen sanely in more cases.)

  In order to take advantage of the C module, just use
  TBinaryProtocolAccelerated instead of TBinaryProtocol.
So why didn't it work? The answer is in TBase.py.
The following conditions have to met in order to use the fast deserializer:
- Protocol must be
TBinaryProtocolAccelerated(I changed that) - Protocol's transport implementation must implement the
TTransport.CReadableTransportinterface thrift_specmust be available (this was true in this case)fastbinarymust be available (also true)
The problem was that we were replacing the TTransport implementation with a custom class called ThriftifyTransport in order to do thrift logging, HMAC authentication, etc.
Fortunately all the default transport implementations implement the CReadableTransport interface, and one of them, TBufferedTransport can be used to wrap another transport to add buffering around it. That's what I did, and it immediately started using the fast deserialization code.
The test call now ran in 3.624 seconds.
And the new profiling results with this change:

The left-hand side of the call graph remained the same, but recv_test_get_users is now only 2.35% of the overall time which is ~0.08 seconds (to be compared with the 1.6 seconds with the original deserializer!)
Optimizing thrift serialization
The obvious next step was to apply this change on the server side as well, so our service can use the fast binary protocol for serialization too. For this I simply copied the change and remeasured everything.
The test call now ran in 3.328 seconds!
Let's see the call graph of this stage:
Optimizing result processing
The client side of the test method was written similar to how the original API method is written:
def test_get_users_thrift(self, count, sleep):
rpc = ThriftRPC(UserDataService, self.name, service_name=self.service_name, client_config=client_config)
result = []
for row in rpc.test_get_users(count, sleep).iteritems():
user = self._row_to_model(self.user_factory, row)
result.append(user)
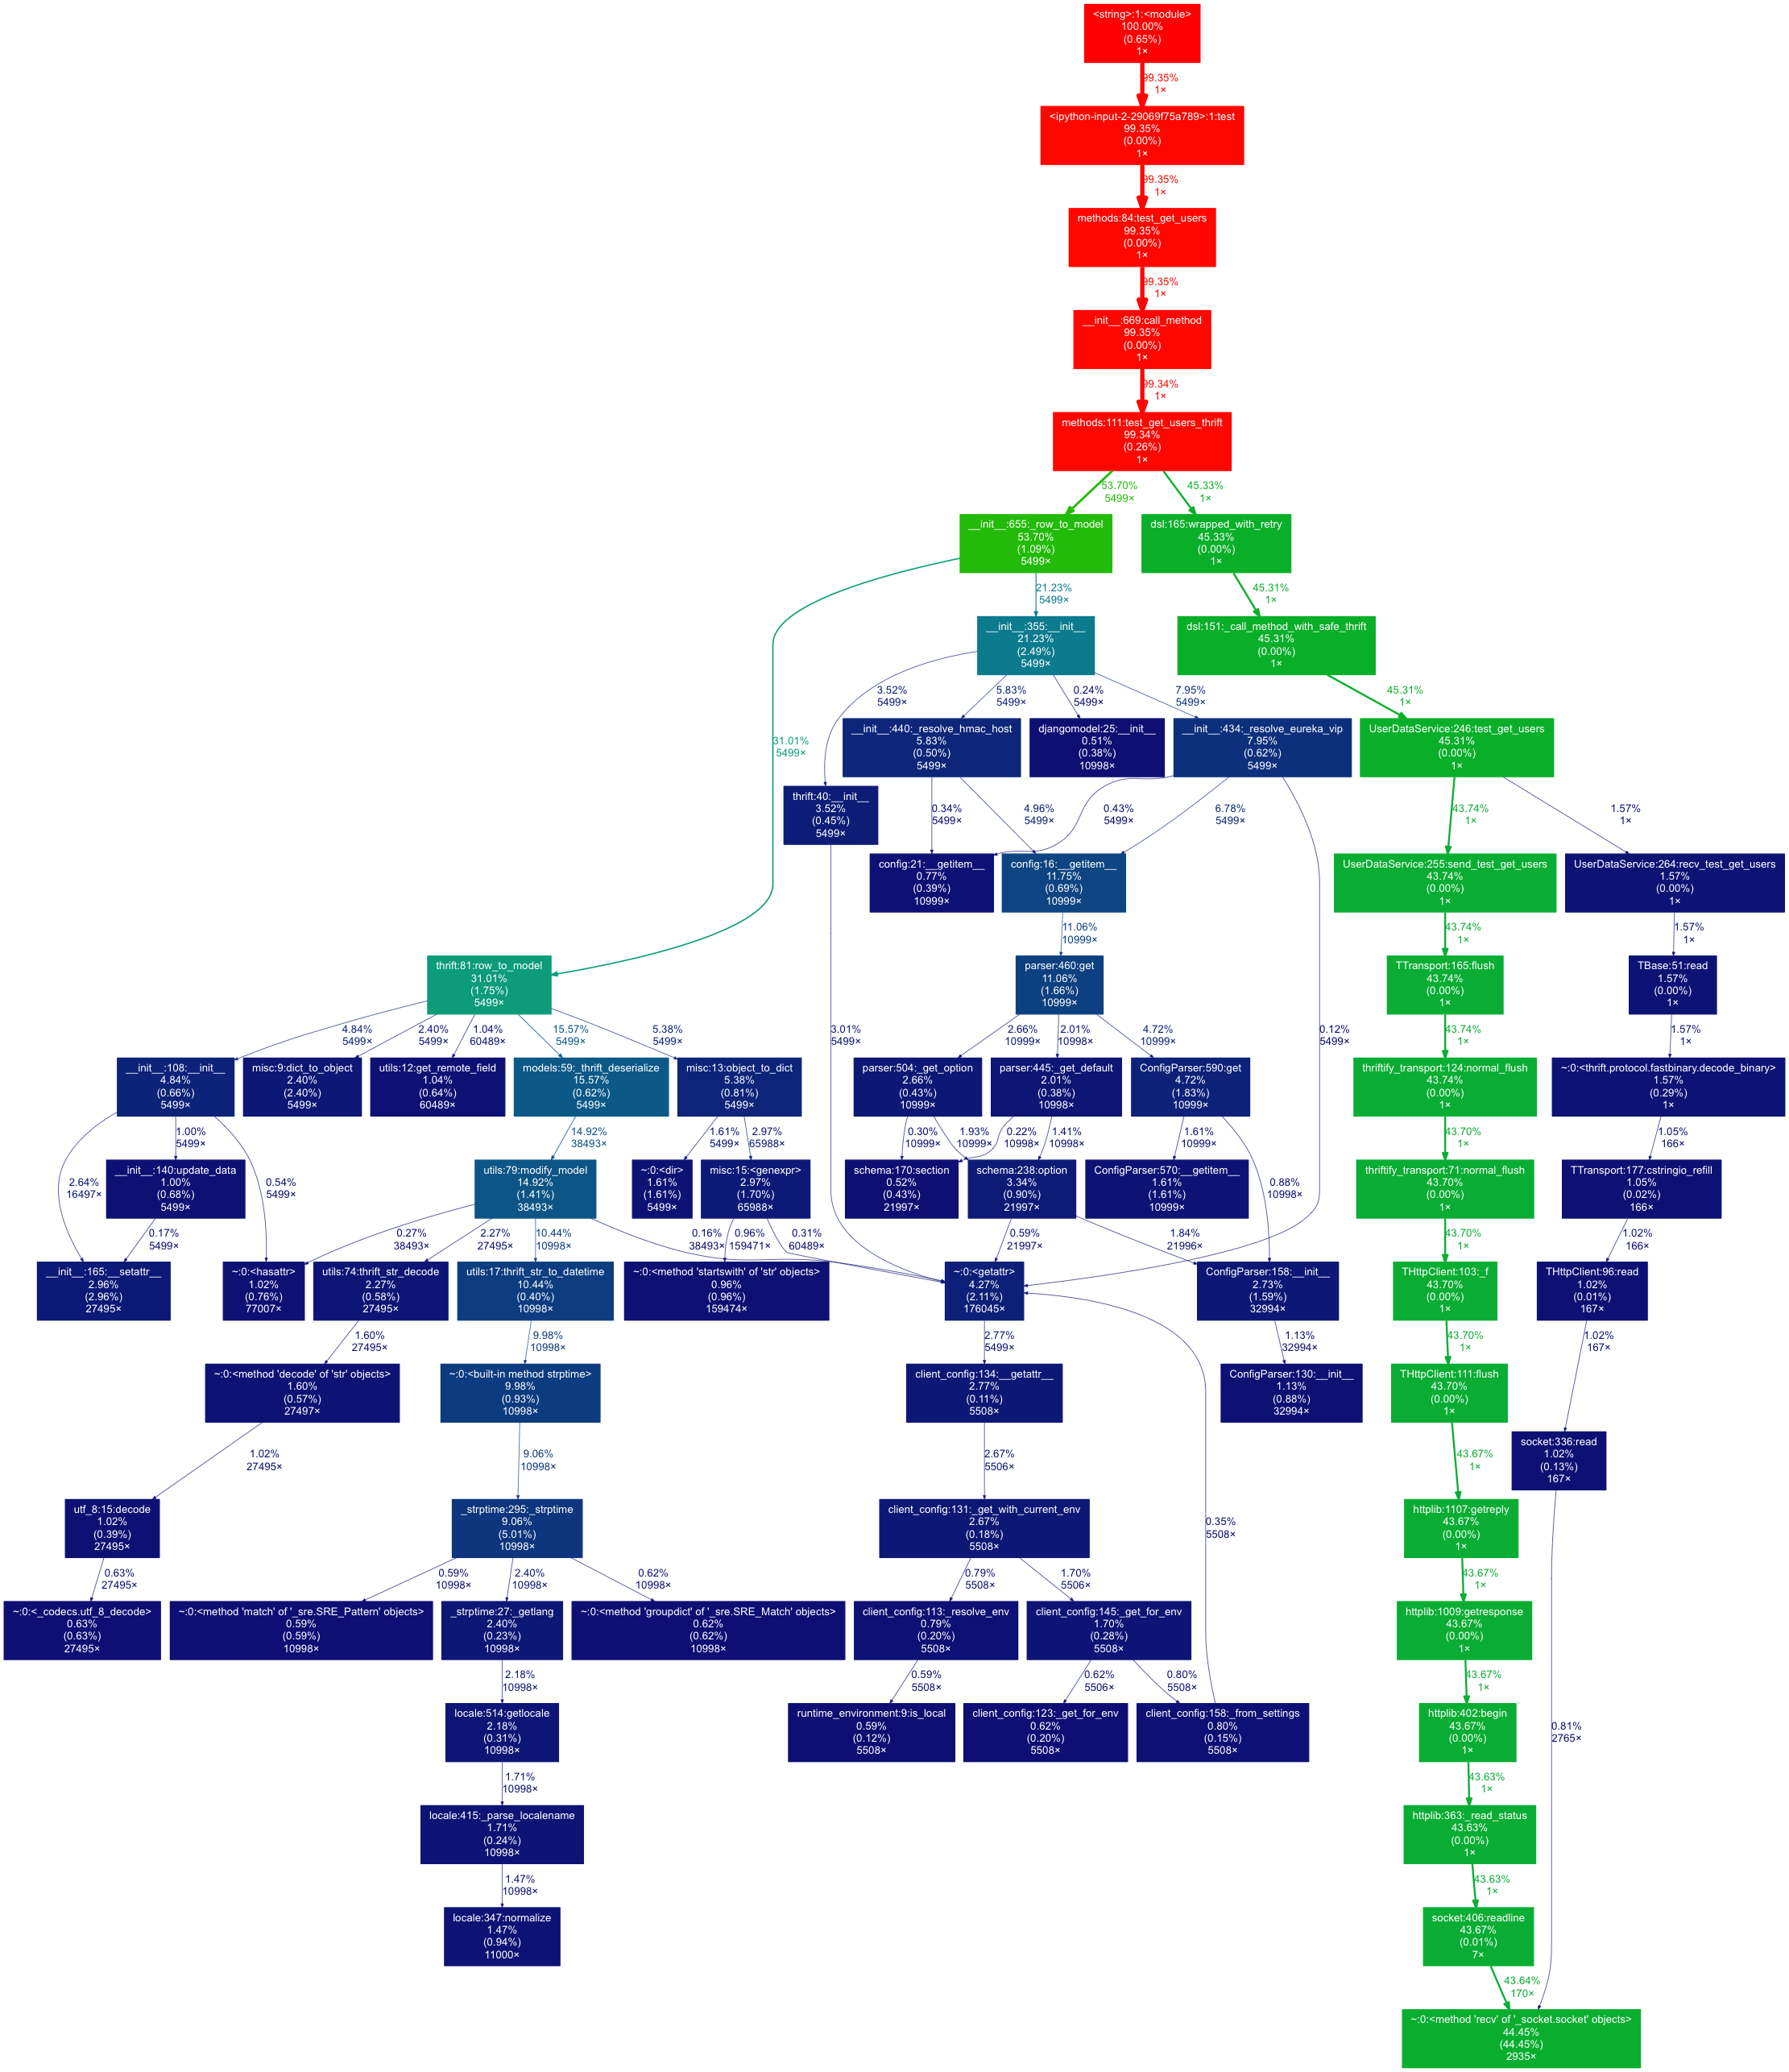
return resultIt is clearly visible on the call graph that the 5499 call to _row_to_model takes 53% of the total time, which is ~1.7 seconds. There are two main branches of this call. The left hand side (row_to_model) seemed to be simple data conversion, and its slowest part is date-time deserialization.
The other branch however looked like a real problem; why should we resolve HMAC host, or parse configuration for each row?
It turned out to be a bug, _row_to_model created a new model factory in each call, which involves a lot of initialization, config parsing, and similar things.
So the simple fix was to create a _rows_to_model helper function which does the same for multiple rows with a single factory.
Running my test code once again showed that the optimization makes sense. Now it ran in 2.448 seconds, with the following call graph:

Further optimizations
I saw two possible ways to further optimize this case:
-
Lazy conversion of raw thrift data to model data (per field). This would make sense because many times only a few fields (the id for example) are used, but it seemed to be a too complex change
-
Checking the server side as well
To profile the server side and only measure the thrift request processing I had to add profiling code to the django view class in the following way:
import cProfile

cProfile.runctx('self._call_processor(op_data)', globals(), locals(), 'callstats')
# self._call_processor(op_data)
The server-side call took 1.691 seconds and looked like this:
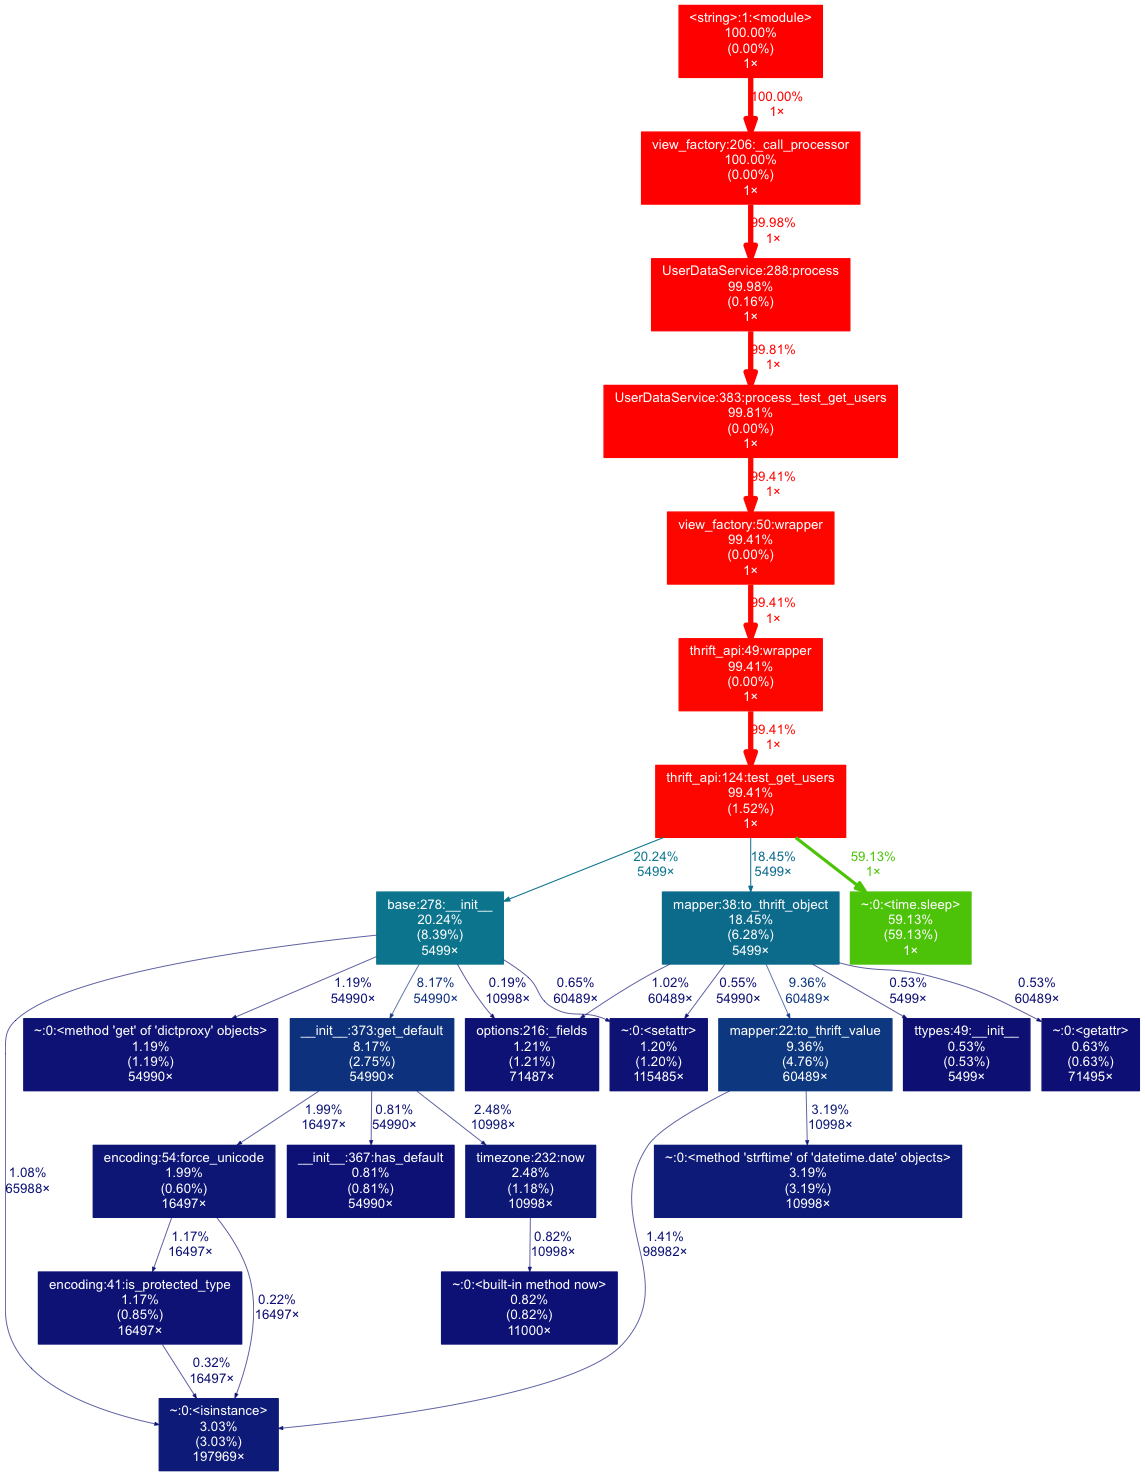
As expected, 60% of this was the 1 second sleep. The rest of the calls are data conversion with no obvious point to improve.
Summary
These optimizations are decreasing the response time significantly, especially for calls returning multiple rows.
The interesting was that the extremely slow performance was caused by both the slow perfomance of the python thrift serializer and a bug in our code.