Golem 1.5 features - Part 14: OpenTelemetry
Posted on April 22, 2026
Introduction
I am writing a series of short posts showcasing the new features of Golem 1.5, to be released at the end of April, 2026. The episodes of this series will be short and assume the reader knows what Golem is. Check my other Golem-related posts for more information!
Parts released so far:
- Part 1: Code-first routes
- Part 2: Webhooks
- Part 3: MCP
- Part 4: Node.js compatibility
- Part 5: Scala support
- Part 6: User-defined snapshotting
- Part 7: Configuration and Secrets
- Part 8: Template simplifications and automatic updates
- Part 9: Agent skills
- Part 10: WebSocket client
- Part 11: Bridge libraries
- Part 12: REPL
- Part 13: Per-agent configuration
- Part 14: OpenTelemetry
- Part 15: MoonBit
- Part 16: Quotas
- Part 17: Semantic retry policies
Oplog processor plugins
Previous Golem versions had an unfinished feature called oplog processor plugins; the basics were already there but we did not have exactly-once delivery semantics for it yet, and there were no actual use cases built on top of it.
With Golem 1.5 the oplog processor plugins are now mature enough for real use. But what is an oplog processor?
Oplog processors are special Golem agents implementing the following interface (currently we only have support for building oplog processors in Rust):
struct Example;

impl OplogProcessorGuest for Example {
    fn process(
        account_info: AccountInfo,
        config: Vec<(String, String)>,
        component_id: ComponentId,
        agent_id: AgentId,
        metadata: AgentMetadata,
        first_entry_index: OplogIndex,
        entries: Vec<OplogEntry>,
    ) -> Result<(), String> {
        // Process the batch of oplog entries here
        Ok(())
    }
}

export_oplog_processor!(Example
    with_types_in golem_rust::oplog_processor);
For agents where a given oplog processor is enabled, the oplog processor instance will periodically receive process calls with the following information:
- account information about the source agent (owner account, environment etc)
- the oplog processor's agent-specific configuration
- the source agent's component ID
- the source agent's ID (agent type and parameters, optionally with a phantom ID)
- detailed agent metadata
- a set of previously unseen oplog entries
Golem guarantees that every oplog entry is sent exactly once to a given oplog processor. It does not have any guarantees though about how many oplog processor instances there are. By default it tries to keep an instance in every executor node, so the oplog delivery is always in-process without any network calls.
Oplog processor plugins are real Golem agents with everything that involves, including durable execution.
Creating and installing plugins
Plugins are WASM files with some metadata; it is possible to create new ones using the Rust Golem SDK and build them with the golem CLI.
The first step is to install the plugin with the CLI:
golem plugin register my-plugin.yamlWhere the YAML file is the plugin metadata:
name: my-oplog-processor
version: v1
description: My custom oplog processor
icon: icon.svg
homepage: https://example.com
specs:
  type: OplogProcessor
  component: "/path/to/my-oplog-processor.wasm"
Once it is registered, it can be referred to by its name and version in the application manifest, and enable it for a component:
components:
  my:component:
    plugins:
      - name: my-oplog-processor
        version: v1
        parameters:
          batch_size: "100"
          target_endpoint: "https://logs.example.com"
It is possible to pass plugin-specific key-value pairs as configuration for each plugin installation. Once a plugin is enabled for a component and the change is deployed, every agent created from this component will have its oplog entries transferred to the plugin. This can be temporarily turned off using the CLI commands golem agent activate-plugin and golem agent deactivate-plugin.
Built-in plugins
Starting from Golem 1.5, each release comes with a set of built-in plugins. These are available for any application without explicitly installing anything. In this release we only have one built-in plugin for exporting agent information via OpenTelemetry.
OpenTelemetry plugin
The OpenTelemetry plugin is a built-in plugin called golem-otlp-exporter that exports agent behavior to OpenTelemetry collectors via OTLP/HTTP, including traces, logs and metrics.
The plugin takes the following configuration keys:
endpointthe OTLP base URLsignalsto enable a combination oftraces,logsandmetricsheadersfor custom HTTP headers to include in the OTLP requestsservice-name-modedetermines what the OTLP service name is going to be: eitheragent-idoragent-type
Let's see what exactly gets exported by the plugin for the three different signals!
Traces
OpenTelemetry spans are created for a few built-in operations, such as agent invocation, RPC calls, outgoing HTTP requests. Users can also define custom spans using the SDK's:
import { startSpan, currentContext } from 'golem:api/context@1.5.0';

const span = startSpan('my-operation');
span.setAttribute('env', { tag: 'string', val: 'production' });
span.setAttributes([
  { key: 'service', value: { tag: 'string', val: 'my-service' } },
  { key: 'version', value: { tag: 'string', val: '1.0' } },
]);

// ... do work ...

const ctx = currentContext();
console.log(`trace_id: ${ctx.traceId()}`);

span.finish();
use golem_rust::bindings::golem::api::context;
// Start a span and set attributes
let span = context::start_span("my-operation");
span.set_attribute("env", &context::AttributeValue::String("production".to_string()));
span.set_attributes(&[
context::Attribute { key: "service".to_string(), value: context::AttributeValue::String("my-service".to_string()) },
context::Attribute { key: "version".to_string(), value: context::AttributeValue::String("1.0".to_string()) },
]);
// ... do work ...
// Read back context
let ctx = context::current_context();
println!("trace_id: {}", ctx.trace_id());
span.finish();import golem.host.ContextApi
val span = ContextApi.startSpan("my-operation")
span.setAttribute("env", ContextApi.AttributeValue.StringValue("production"))
span.setAttributes(List(
ContextApi.Attribute("service", ContextApi.AttributeValue.StringValue("my-service")),
ContextApi.Attribute("version", ContextApi.AttributeValue.StringValue("1.0")),
))
// ... do work ...
val ctx = ContextApi.currentContext()
println(s"trace_id: ${ctx.traceId()}")
span.finish()// Using with_span for automatic lifecycle management:
@context.with_span(
"my-operation",
attributes=[("env", "production"), ("service", "my-service"), ("version", "1.0")],
fn(span) {
// ... do work ...
// Add more attributes dynamically if needed:
span.set_attribute("step", "processing")
let ctx = @context.current_context()
println("trace_id: " + ctx.trace_id())
},
)Note that trace and span IDs are properly propagated from inbound HTTP requests through the code-first routes, and outgoing HTTP requests are also having the standard trace headers. This is a feature independent from the OTLP plugin.
For TypeScript there is an alternative - we wired the invocation context feature to our runtime's Node.js node:diagnostics_channel module:
import { tracingChannel } from 'node:diagnostics_channel';
// Now any traceSync/tracePromise call automatically creates a Golem span
// with attributes from the context object's properties
const dc = tracingChannel('my-operation');
const result = dc.traceSync(
() => {
// ... do work ...
return 42;
},
{ method: 'GET', url: '/api/data', env: 'production' } // these become span attributes
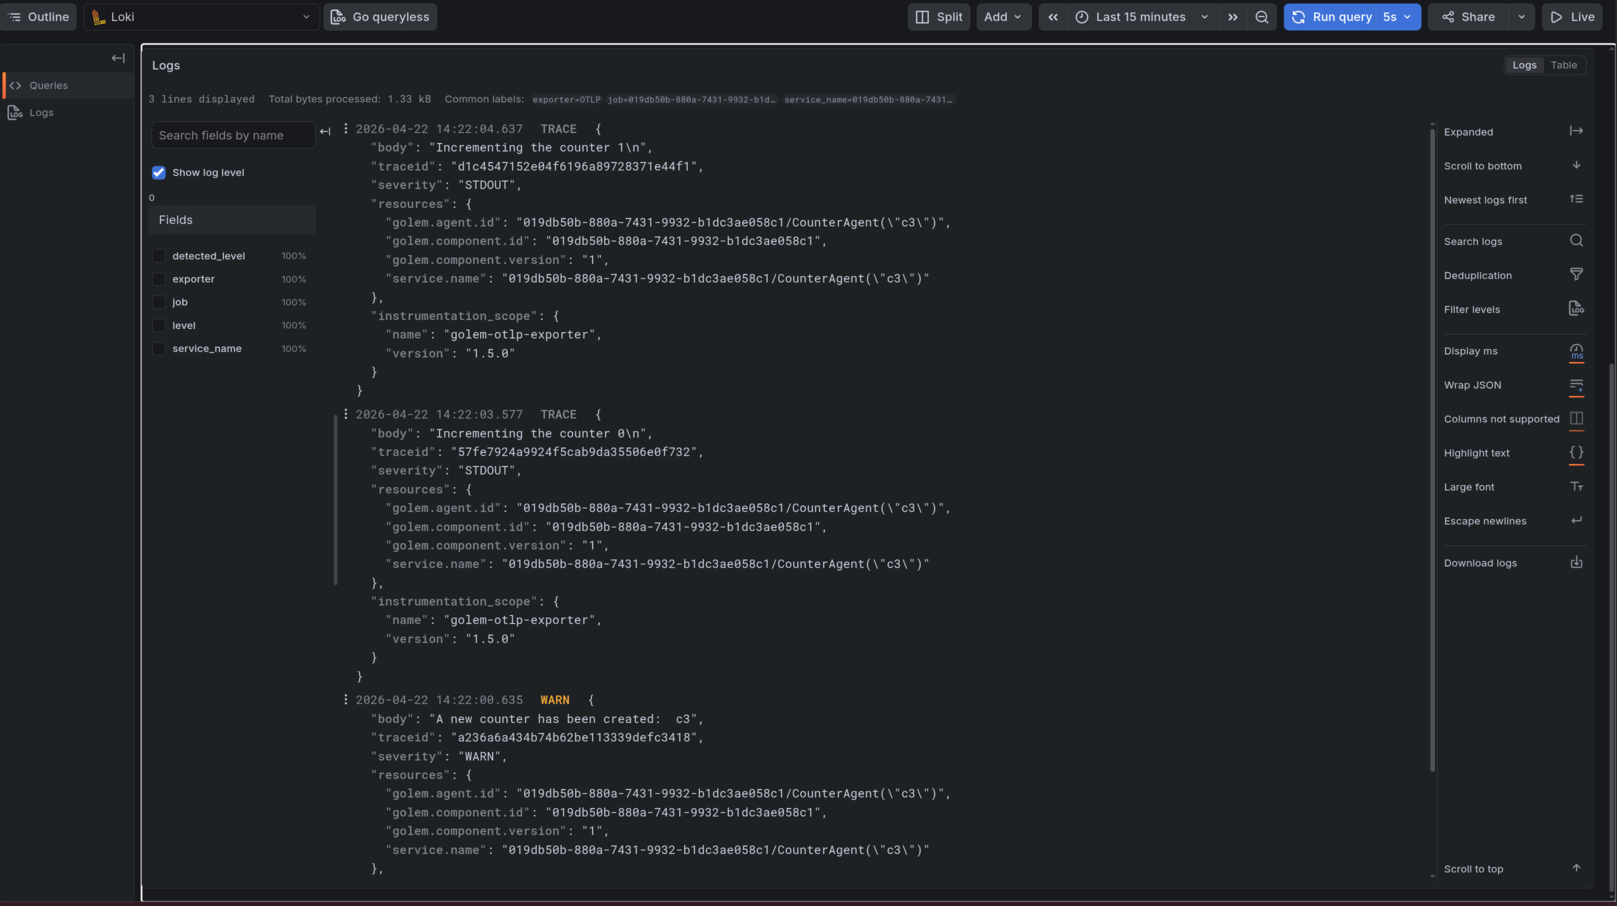
);Logs
When log exporting is enabled, any log entry (standard output/err or using the dedicated log interfaces) are being forwarded to the OTLP collector.
console.log("Hello from TypeScript!");
console.debug("This is a debug log entry");
use log::debug;
println!("Hello from Rust!");
debug!("This is a debug log entry");println("Hello from Scala!")
Logging.log(LogLevel.Debug, "", "This is a debug log entry")println("Hello from MoonBit!")
@log.debug("This is a debug log entry")Metrics
When metrics are enabled, the plugin will send the following metrics to the OTLP collector:
| Metric Name | Type | Description |
|---|---|---|
golem_invocation_count | Counter | Number of agent method invocations |
golem_invocation_duration_ns | Counter | Invocation duration |
golem_invocation_fuel_consumed | Counter | Fuel consumed by invocations |
golem_invocation_pending_count | Counter | Number of pending invocations |
golem_host_call_count | Counter | Number of internal host calls |
golem_log_count | Counter | Number of log entries emitted |
golem_memory_initial_bytes | Gauge | Initially allocated memory |
golem_memory_total_bytes | Gauge | Total allocated memory |
golem_memory_growth_bytes | Counter | Memory growth since start |
golem_component_size_bytes | Gauge | Component size in bytes |
golem_error_count | Counter | Number of recorded errors |
golem_interruption_count | Counter | Number of interrupt requests |
golem_exit_count | Counter | Number of process exit signals |
golem_restart_count | Counter | Number of times a fresh state was created |
golem_resources_created | Counter | Number of internal resources created |
golem_resources_dropped | Counter | Number of internal resources dropped |
golem_resources_active | Gauge | Number of active internal resources |
golem_update_success_count | Counter | Number of successful updates |
golem_update_failure_count | Counter | Number of failed updates |
golem_transaction_committed | Counter | Number of committed database transactions |
golem_transaction_rolled_back | Counter | Number of rolled back database transactions |
golem_snapshot_size_bytes | Counter | Snapshot size in bytes |
golem_oplog_processor_lag | Gauge | Oplog processor delivery lag |
Each metric is annotated with the standard service.name that identifies the agent type, with golem.agent.id identifying the instance, and with golem.component.id and golem.component.version to identify the deployment.
Setting it up
As it is a built-in plugin, the only thing necessary is enabling it in the application manifest:
components:
  otlp-demo:ts-main:
    templates: ts
    plugins:
      - name: golem-otlp-exporter
        version: 1.5.0
        parameters:
          endpoint: "http://localhost:4318"
          signals: "traces,logs,metrics"
After golem deploy, newly created agents defined in this component are going to send their information to the OTLP exporter plugin.
For example we can launch a local stack of opentelemetry-collector / grafana / loki / prometheus / jaeger to get support for all three signals. The golem repository contains an example docker compose setup for this, as well as an agent skill describing how to set it up.
Example
On the following screenshots we can see how this default stack shows traces, logs and metrics from a simple counter agent example:
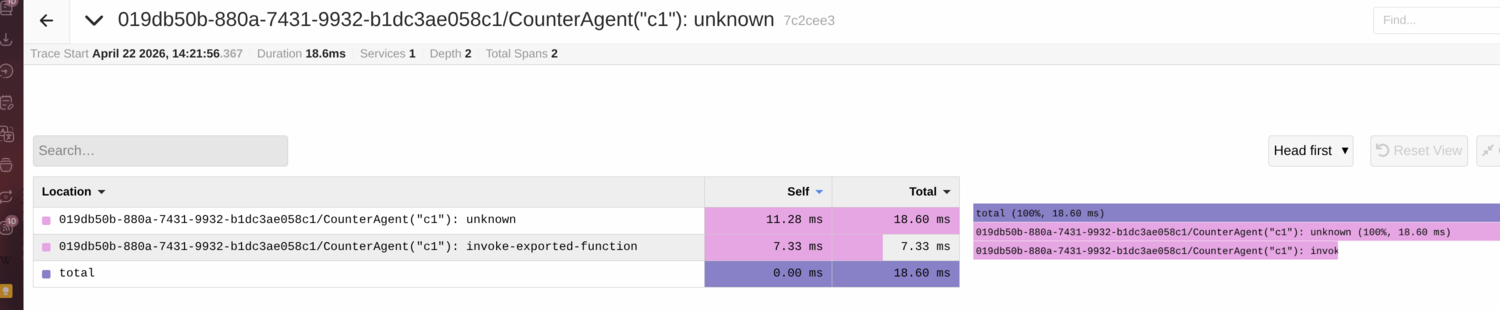
Traces:
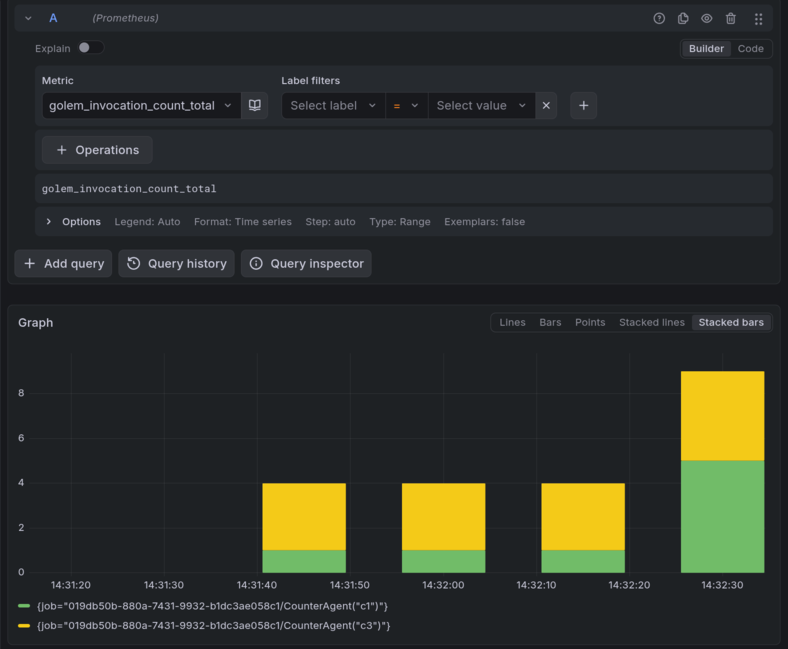
Metrics:
Logs: